Vineel Rayapati
Data Scientist
DATA Collection
About data and Data Sources
This project relies on two key datasets: financial news headlines and historical stock price data, both carefully gathered and processed to ensure relevance and accuracy. The news dataset was scraped from the Markets Insider platform, focusing on articles related to Nvidia stock over a 90-day period. Using a custom Python script powered by BeautifulSoup, the scraper retrieved information such as article titles, publication dates, sources, and links. A sentiment analysis tool, TextBlob, was then employed to assign sentiment scores to each headline, categorizing them as positive, negative, or neutral. This enriched the dataset with valuable qualitative insights into market sentiment surrounding Nvidia.
In parallel, historical stock price data was sourced from Yahoo Finance, providing granular hourly data on Nvidia’s stock performance. Key attributes like opening price, closing price, high, low, and trading volume were included, offering a quantitative perspective on market movements. By aligning the timestamps of the news articles with the closest corresponding stock data, a comprehensive dataset was created. This integration allowed the project to explore how news sentiment impacts specific market metrics.
The final dataset combines over 90 days of detailed financial news with Nvidia’s hourly stock performance, ensuring a rich mix of qualitative and quantitative data for predictive modeling. This blend provides a foundation for building advanced machine learning models capable of uncovering relationships between news sentiment and stock price fluctuations. The datasets are robust and reliable, setting the stage for insightful analysis and actionable predictions.
Data Sources:
-
News Data: Markets Insider (via web scraping)
-
Stock Data: Yahoo Finance API


Data Cleaning and Preparation


The raw financial news and stock data were imported into Pandas dataframes for processing in Python. The news dataset contains headlines, publication dates, and sources, while the stock dataset includes hourly Nvidia stock prices with attributes like open, high, low, close, and volume.
Sentiment Analysis
Each news headline was analyzed using the FinBERT pre-trained model to capture sentiment (Positive, Neutral, or Negative) and a corresponding sentiment score. These scores provided a quantitative measure of the tone of the news articles, forming a critical feature for analysis.
Data Alignment
To align news articles with corresponding stock prices, timestamps were used to match news data with the nearest stock data point. This ensured that sentiment features reflected the stock’s context at the time.
Handling Missing Data
Records with missing key values, such as stock prices or sentiment scores, were dropped to maintain data integrity. This reduced potential bias or errors during modeling.
Outlier Detection and Conversion
Stock price columns were inspected for formatting inconsistencies. Bracketed or improperly formatted numeric values were cleaned and converted into usable numeric types.
Removing Duplicates
Duplicate entries, identified during the cleaning process, were removed to ensure the dataset remained concise and free from redundancy.
Index Resetting and Organization
After cleaning, the dataset’s index was reset, and all changes were saved into a cleaned dataset file: `nvda_news_with_finbert_and_stock_data_cleaned.csv`. This ensured the dataset was ready for reliable analysis and modeling.
Together, these steps transformed the raw data into a well-structured, comprehensive dataset that combines qualitative sentiment analysis with quantitative stock price data, forming a strong foundation for predictive modeling.
Raw Data
Cleaned Data

Here is the Xml file data which is unorganized

Here is the CSV file where data is organized and rearranged
Data Vizualization
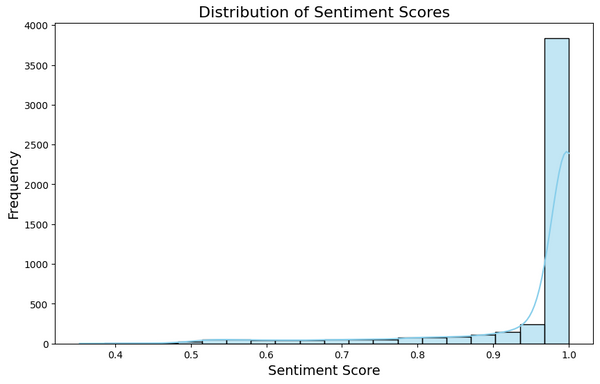
Histogram for Sentiment Scores
histogram visualizes the distribution of sentiment scores derived from news headlines about Nvidia stock. The x-axis represents sentiment scores, ranging from -1 (negative) to +1 (positive), while the y-axis indicates the frequency of each score range. The majority of scores cluster near 1, revealing that most news articles carried a positive tone. The KDE curve overlays the histogram to smooth the distribution, providing a clearer understanding of sentiment trends. This visualization highlights a predominantly favorable sentiment surrounding Nvidia during the analyzed period, offering valuable insights into market perception and its potential influence on stock price movements.


Line Graph for Stock Close Price
TThis line plot visualizes the trend in Nvidia’s stock close price over a specified time period. The x-axis represents the timeline, while the y-axis shows the closing price of the stock. The downward trajectory indicates a general decline in Nvidia’s stock price over time, with noticeable fluctuations at certain intervals. Peaks and troughs in the graph suggest periods of volatility, likely influenced by market events or news. This visualization is instrumental in understanding the overall performance of Nvidia’s stock and can provide context when paired with sentiment data to analyze how news impacts stock trends.
Scatter plot of Sentiment Score vs Stock Close Price
This scatter plot illustrates the relationship between sentiment scores from news headlines and Nvidia’s stock closing prices. The x-axis represents sentiment scores ranging from 0.4 (negative/neutral) to 1 (highly positive), while the y-axis shows stock close prices. Each point represents a data pair, mapping how sentiment aligns with stock performance. The clustering of points at higher sentiment scores (near 1) indicates a prevalence of positive sentiment during the analyzed period. However, the scatter does not reveal a strong direct correlation between sentiment and stock prices, suggesting that other factors may influence price movements. This plot highlights sentiment's potential impact on stock dynamics.
4o
